
6 Powerful AI Coaching Analytics Dashboard Tools for Business Visibility
AI coaching analytics dashboard platforms help coaching businesses consolidate revenue metrics, client metrics, conversion rates, and engagement tracking into one unified performance overview.
Many coaching businesses operate using fragmented data. Revenue information may live inside payment platforms, client activity data may exist inside learning platforms, and marketing performance may sit inside advertising dashboards or email tools.
This fragmentation creates a major visibility problem.
When data is scattered across multiple tools, it becomes difficult for coaches to answer fundamental business questions such as:
- Which offers generate the most revenue
- Which coaching programs have the best client engagement
- Which funnels produce the highest conversion rates
- Whether revenue trends are improving or declining
- Which areas of the business require attention
Without a centralized analytics view, coaches often make decisions based on assumptions rather than measurable performance data.
This is where an ai coaching analytics dashboard becomes valuable.
Analytics dashboards consolidate information from multiple sources into a single interface. Instead of opening several tools to understand business performance, coaches can view revenue metrics, client engagement insights, and offer performance data in one place.
These dashboards act as a business intelligence layer for coaching companies. They provide a structured overview of how the business is performing across different areas.
For coaches building a complete analytics infrastructure, these dashboards form one layer within a larger ecosystem of operational tools. A broader overview can be found in AI tools for coaches and consultants.
Quick Comparison Table
Below is a comparison of several popular analytics platforms used to build coaching performance dashboards.
| Tool | Revenue Metrics | Client Metrics | Conversion Tracking | Engagement Tracking | Dashboard Customization |
|---|---|---|---|---|---|
| Databox | Strong | Strong | Strong | Moderate | Strong |
| Tableau | Strong | Strong | Strong | Strong | Strong |
| Power BI | Strong | Strong | Strong | Strong | Strong |
| Looker Studio | Moderate | Moderate | Strong | Moderate | Strong |
| Klipfolio | Strong | Moderate | Strong | Moderate | Strong |
| Geckoboard | Moderate | Moderate | Moderate | Moderate | Strong |
| SimpleKPI | Moderate | Moderate | Moderate | Moderate | Moderate |
Each of these tools offers different strengths depending on the complexity of the coaching business and the level of analytics depth required.

Why Businesses Need This Software
Many coaching businesses underestimate the importance of structured analytics systems. But as the business grows, analytics becomes one of the most important operational layers.
Analytics dashboards provide visibility into four critical areas of a coaching business.
Revenue Visibility
The first advantage of an analytics dashboard is revenue visibility.
Revenue metrics may include:
- total revenue
- revenue per program
- average deal value
- revenue growth trends
- revenue per client segment
Instead of manually compiling reports, dashboards visualize revenue data automatically.
This helps coaches understand whether the business is expanding, plateauing, or declining.
Client Engagement Monitoring
Client engagement is an important indicator of program success.
Analytics dashboards can track metrics such as:
- session attendance
- course completion rates
- community participation
- client activity levels
High engagement often correlates with strong client outcomes and higher retention rates.
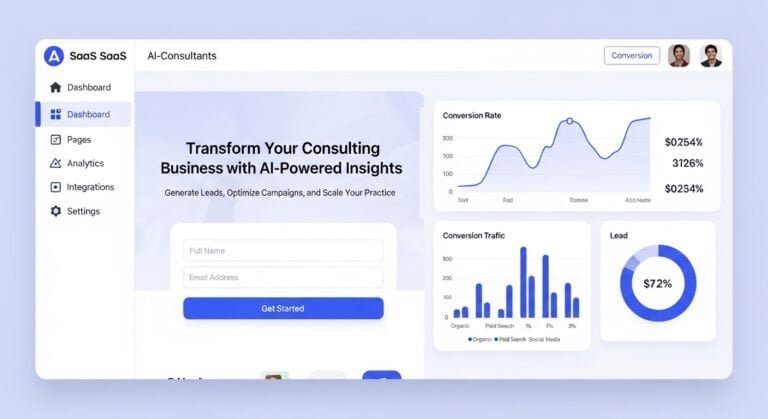
Conversion Rate Analysis
Conversion rates reveal how effectively coaching offers convert prospects into paying clients.
Dashboards may display metrics such as:
- funnel conversion rates
- enrollment rates for coaching programs
- sales performance by offer
These insights help coaches refine offers and sales strategies.
Many of these insights come from systems related to ai coaching marketing analytics software, which track the performance of marketing channels and lead generation activities.
Business Health Monitoring
Analytics dashboards also act as an early warning system.
If conversion rates drop, revenue trends decline, or engagement decreases, the dashboard can reveal the issue quickly.
This allows coaches to address problems before they significantly affect the business.

Key Features to Look For
Not all analytics dashboards provide the same capabilities. Coaches should evaluate several key features before selecting a platform.
Unified Dashboard Interface
A good analytics platform should provide a unified dashboard interface.
This interface should consolidate:
- revenue metrics
- client activity data
- offer performance
- funnel performance
The goal is to eliminate the need to switch between multiple tools.
Customizable Metrics
Different coaching businesses track different metrics.
Some may focus heavily on client engagement, while others prioritize revenue analytics or marketing performance.
Customizable dashboards allow businesses to track the metrics that matter most.
Data Integration
Analytics dashboards typically rely on integrations with other tools.
Examples include:
- payment platforms
- marketing platforms
- learning management systems
- community platforms
Integration ensures the dashboard receives accurate real-time data.
Offer Performance Tracking
One of the most valuable features is the ability to analyze offer performance.
This includes insights such as:
- revenue generated by each program
- conversion rates per offer
- enrollment trends
Offer performance tracking helps coaches determine which products should be expanded or improved.
Funnel Performance Overview
Analytics dashboards often display funnel performance metrics.
These may include:
- visitor-to-lead conversion rates
- lead-to-client conversion rates
- funnel drop-off points
Understanding funnel performance allows coaches to identify where potential clients disengage.
Visual Data Presentation
Good analytics dashboards use visual data displays such as:
- graphs
- charts
- performance indicators
Visual insights make it easier to understand complex business data.

Best Tools
Several platforms provide strong capabilities for building AI coaching analytics dashboards.
1. Databox
Databox is widely used for creating customizable business dashboards.
The platform allows users to connect data sources such as payment systems, marketing tools, and analytics platforms.
Databox dashboards provide visual insights into revenue metrics, client activity, and marketing performance.
The tool is especially popular among service businesses that want simple but powerful analytics visibility.
2. Tableau
Tableau is one of the most advanced data visualization platforms available.
It allows businesses to build highly customizable analytics dashboards with deep data analysis capabilities.
Tableau is best suited for coaching businesses that require complex analytics models or advanced data analysis.
However, it may require more technical setup compared with simpler dashboard tools.
3. Microsoft Power BI
Power BI is a powerful analytics platform that integrates well with many data sources.
The platform allows businesses to create sophisticated dashboards that display revenue trends, conversion metrics, and engagement data.
Power BI is often used by organizations that need strong data analysis capabilities combined with flexible reporting.
4. Looker Studio
Looker Studio provides customizable dashboards that connect easily with marketing and analytics data sources.
The platform is commonly used to visualize funnel performance and marketing analytics data.
It is particularly useful for coaching businesses that rely heavily on digital marketing.
5. Klipfolio
Klipfolio offers customizable dashboards designed for real-time performance monitoring.
The platform allows businesses to track metrics across multiple systems and display them in a single interface.
Klipfolio dashboards are often used for operational performance monitoring.
6. Geckoboard
Geckoboard is a dashboard platform designed for simple performance monitoring.
It is commonly used by teams that want to display key metrics on shared screens.
While it may not offer the deepest analytics capabilities, it provides clear performance overviews.

Pricing Overview
Pricing for analytics dashboard platforms varies depending on the level of customization and data complexity.
Entry-Level Dashboard Tools
Basic analytics dashboards often cost between:
$20 to $70 per month
These tools provide standard dashboards with limited customization.
Mid-Tier Analytics Platforms
More advanced analytics platforms may cost between:
$80 to $300 per month
These platforms provide deeper data integrations and advanced visualization capabilities.
Enterprise Analytics Platforms
Enterprise-level analytics platforms may cost:
$500 or more per month
These platforms are designed for businesses that require complex analytics models and large data integrations.

How to Choose the Right Tool
Choosing an analytics dashboard requires understanding the complexity of the coaching business.
Several factors should guide the decision.
Business Size
Smaller coaching businesses may not require enterprise-level analytics platforms.
Simple dashboard tools may be sufficient.
Larger coaching organizations with multiple programs may benefit from more advanced analytics systems.
Data Sources
The number of systems generating data influences the ideal platform.
Businesses using many tools may require dashboards with strong integration capabilities.
Analytics Complexity
Some businesses only need simple revenue and client metrics.
Others require deeper insights such as funnel performance analysis and offer-level revenue tracking.
Analytics complexity determines the appropriate platform.
Ease of Use
Complex analytics tools may require technical expertise.
Coaches should choose platforms that balance analytical power with ease of use.

Final Recommendation
As coaching businesses grow, data becomes increasingly important for strategic decision-making.
Relying on fragmented analytics tools often leads to incomplete insights and inefficient reporting processes.
An ai coaching analytics dashboard solves this problem by consolidating business metrics into a unified interface.
These dashboards provide visibility into revenue metrics, client engagement, conversion rates, and overall business performance.
With structured analytics systems in place, coaches can evaluate offer performance, monitor funnel effectiveness, and maintain a clear overview of business health.
While the ideal platform depends on the size and complexity of the business, implementing a centralized analytics dashboard is an important step toward building a data-driven coaching organization.
FAQ
1. What is an AI coaching analytics dashboard?
An AI coaching analytics dashboard is a unified platform that displays revenue metrics, client performance data, conversion rates, and engagement tracking in one interface.
2. Why do coaching businesses need analytics dashboards?
Analytics dashboards provide a clear performance overview, helping coaches make data-driven decisions based on revenue trends, client engagement, and conversion rates.
3. What metrics should be tracked in a coaching analytics dashboard?
Key metrics include revenue metrics, client metrics, conversion rates, engagement tracking, and offer performance data.
4. How do analytics dashboards improve business performance?
They help identify growth opportunities, track performance trends, and highlight areas that need improvement.
5. Are analytics dashboards suitable for small coaching businesses?
Yes. Even small coaching businesses benefit from centralized performance tracking and better decision-making.
Disclaimer
The information provided in this article is for educational and informational purposes only. While we aim to keep content accurate and up to date, software features and availability may change over time. Some links on this page may be affiliate links, meaning we may earn a commission if you purchase through them at no additional cost to you. Always evaluate tools based on your specific business needs before making a decision.